W199 Просмотр технического описания (PDF) - Cypress Semiconductor
Номер в каталоге
Компоненты Описание
Список матч
W199 Datasheet PDF : 14 Pages
| |||
PRELIMINARY
W199
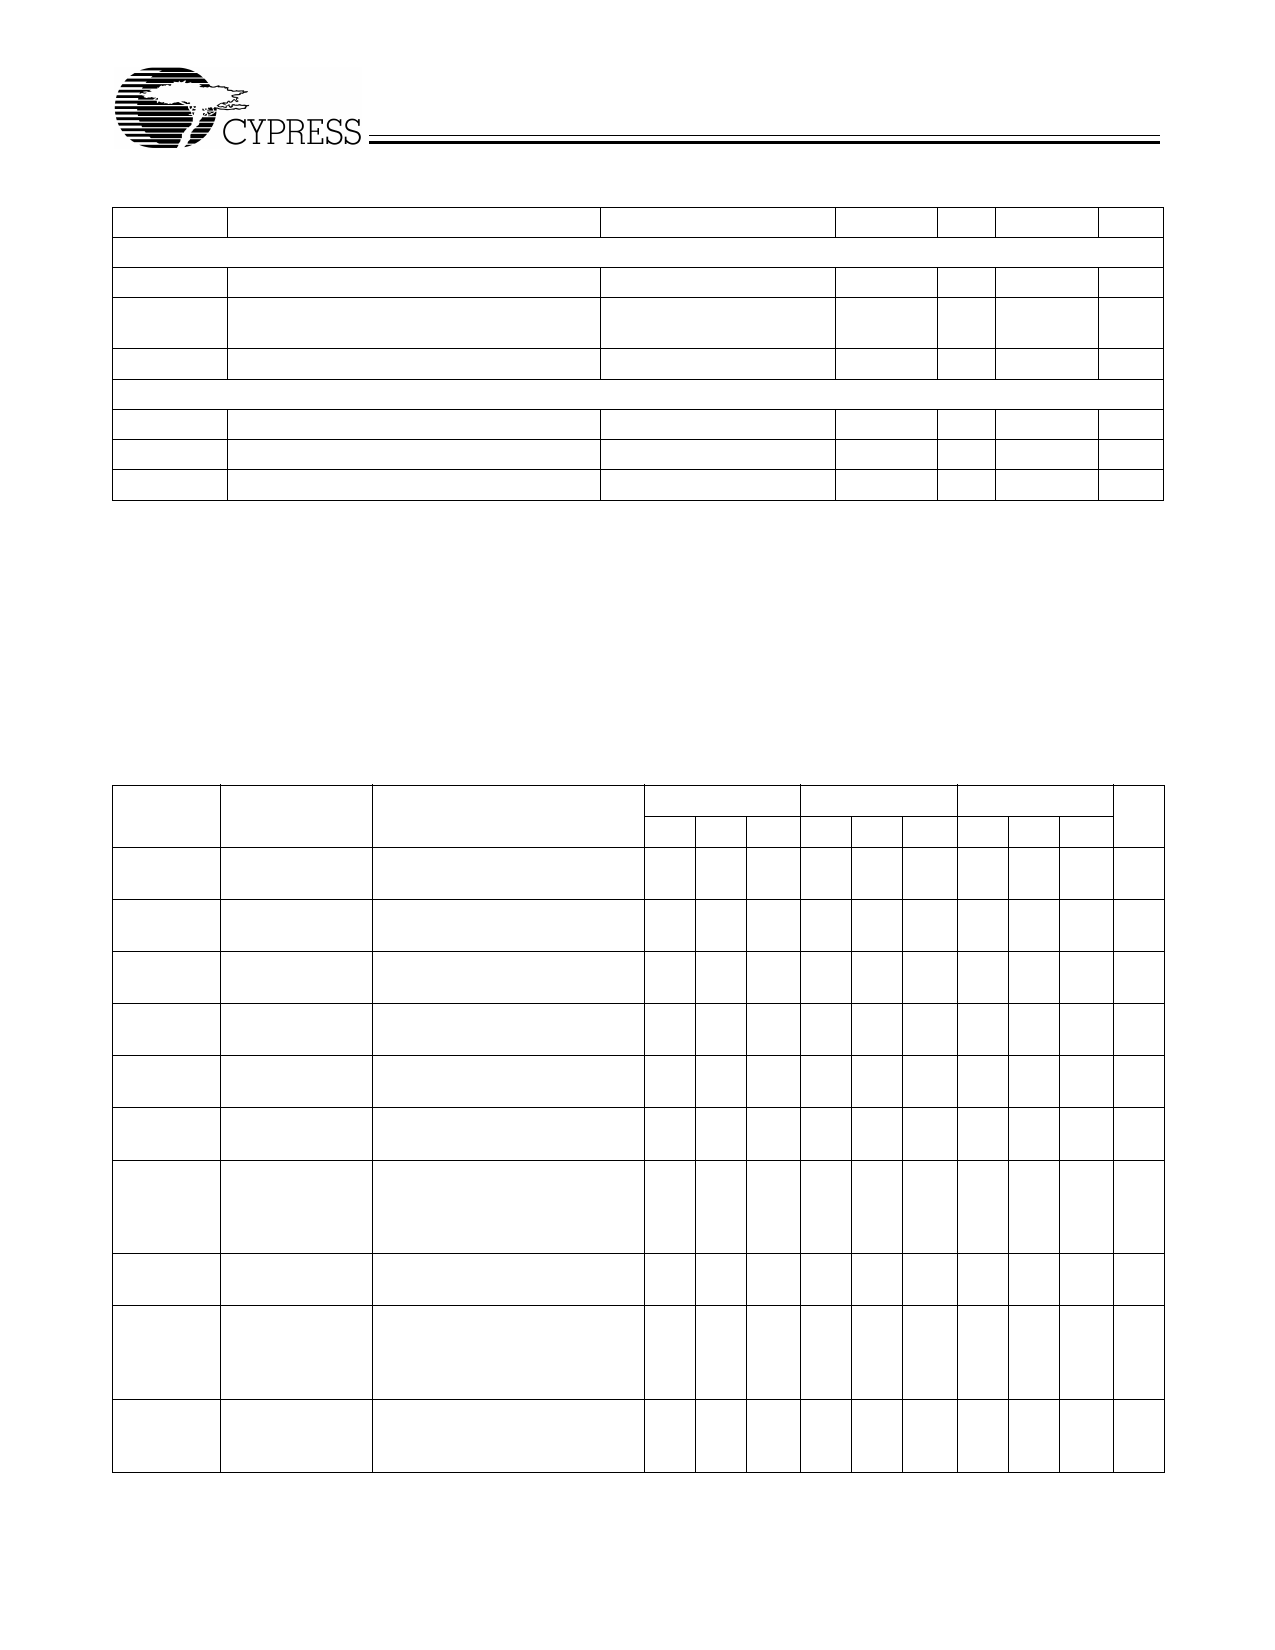
DC Electrical Characteristics: (continued) TA = 0°C to +70°C; VDDQ3 = 3.3V±5%; VDDQ2 = 2.5V±5%
Parameter
Description
Test Condition
Min. Typ. Max. Unit
Crystal Oscillator
VTH
X1 Input threshold Voltage[5]
CLOAD
Load Capacitance, Imposed on
External Crystal[6]
CIN,X1
X1 Input Capacitance[7]
Pin Capacitance/Inductance
VDDQ3 = 3.3V
Pin X2 unconnected
1.65
V
14
pF
28
pF
CIN
Input Pin Capacitance
Except X1 and X2
5
pF
COUT
Output Pin Capacitance
6
pF
LIN
Input Pin Inductance
7
nH
Notes:
5. X1 input threshold voltage (typical) is VDDQ3/2.
6. The W199 contains an internal crystal load capacitor between pin X1 and ground and another between pin X2 and ground. Total load placed on crystal is
14 pF; this includes typical stray capacitance of short PCB traces to crystal.
7. X1 input capacitance is applicable when driving X1 with an external clock source (X2 is left unconnected).
AC Electrical Characteristics
TA = 0°C to +70°C; VDDQ3 = 3.3V±5%; VDDQ2 = 2.5V±5%; fXTL = 14.31818 MHz
AC clock parameters are tested and guaranteed over stated operating conditions using the stated lump capacitive load at the
clock output; Spread Spectrum clocking is disabled.
CPU Clock Outputs, CPU_F, CPU1 (Lump Capacitance Test Load = 20 pF)
CPU = 66.8 MHz CPU = 100 MHz CPU = 133 MHz
Parameter Description Test Condition/Comments Min. Typ. Max. Min. Typ. Max. Min. Typ. Max. Unit
tP
Period
Measured on rising edge at
15
1.25
15.5 10
10.5 7.5
8.0 ns
tH
High Time
Duration of clock cycle above 5.2
3.0
1.87
ns
2.0V
tL
Low Time
Duration of clock cycle below 5.0
2.8
1.67
ns
0.4V
tR
Output Rise
Measured from 0.4V to 2.0V
1
41
41
4 V/ns
Edge Rate
tF
Output Fall Edge Measured from 2.0V to 0.4V
1
41
41
4 V/ns
Rate
tD
Duty Cycle
Measured on rising and falling 45
55 45
55 45
55 %
edge at 1.25V
tJC
Jitter,
Measured on rising edge at
Cycle-to-Cycle 1.25V. Maximum difference of
cycle time between two
adjacent cycles.
200
200
200 ps
tSK
Output Skew Measured on rising edge at
1.25V
175
175
175 ps
fST
Frequency Sta- Assumes full supply voltage
3
3
3 ms
bilization from reached within 1 ms from pow-
Power-up (cold er-up. Short cycles exist prior to
start)
frequency stabilization.
Zo
AC Output
Average value during switching
20
20
20
Ω
Impedance
transition. Used for determining
series termination value.
10
Share Link: 