AD8340 Просмотр технического описания (PDF) - Analog Devices
Номер в каталоге
Компоненты Описание
Список матч
AD8340 Datasheet PDF : 20 Pages
| |||
Data Sheet
I-Q ATTENUATORS AND BASEBAND AMPLIFIERS
The proprietary linear-responding attenuator structure is an
active solution with differential inputs and outputs that offer
excellent linearity, low noise, and greater immunity from mis-
matches than other variable attenuator methods. The gain, in
linear terms, of the I and Q channels is proportional to its control
voltage with a scaling factor designed to be 2/V, that is, a full-scale
gain setpoint of 1.0 (−2 dB) for VBBI (Q) of 500 mV. The control
voltages can be driven differentially or single-endedly. The
combination of the baseband amplifiers and attenuators allows
for maximum modulation bandwidths in excess of 200 MHz.
OUTPUT AMPLIFIER
The output amplifier accepts the sum of the attenuator outputs
and delivers a differential output signal into the external load.
The output pins must be pulled up to an external supply,
preferably through RF chokes. When the 50 Ω load is taken
differentially, an OP1dB of 11 dBm and OIP3 of 24 dBm are
achieved at 880 MHz. The output can be taken in single-ended
fashion, albeit at lower performance levels.
NOISE AND DISTORTION
The output noise floor and distortion levels vary with the gain
magnitude but do not vary significantly with the phase. At the
higher gain magnitude setpoints, the OIP3 and the noise floor
vary in direct proportion with the gain. At lower gain magni-
tude setpoints, the noise floor levels off while the OIP3 continues
to vary with the gain.
AD8340
GAIN AND PHASE ACCURACY
There are numerous ways to express the accuracy of the AD8340.
Ideally, the gain and phase should precisely follow the setpoints.
Figure 4 illustrates the gain error in decibels (dB) from a best fit
line, normalized to the gain measured at the gain setpoint = 1.0,
for the different phase setpoints. Figure 6 shows the gain error
in a different form; the phase setpoint is swept from 0° to 360°
for different gain setpoints. Figure 8 and Figure 22 show analo-
gous errors for the phase error as a function of gain and phase
setpoints. The accuracy clearly depends on the region of operation
within the vector gain unit circle. Operation very close to the
origin generally results in larger errors as the relative accuracy
of the I and Q vectors degrades.
RF FREQUENCY RANGE
The frequency range on the RF input is limited by the internal
polyphase quadrature phase-splitter. The phase-splitter splits
the incoming RF input into two signals, 90° out of phase, as
previously described in the RF Quadrature Generator section.
This polyphase network has been designed to ensure robust
quadrature accuracy over standard fabrication process
parameter variations for the 700 MHz to 1 GHz specified RF
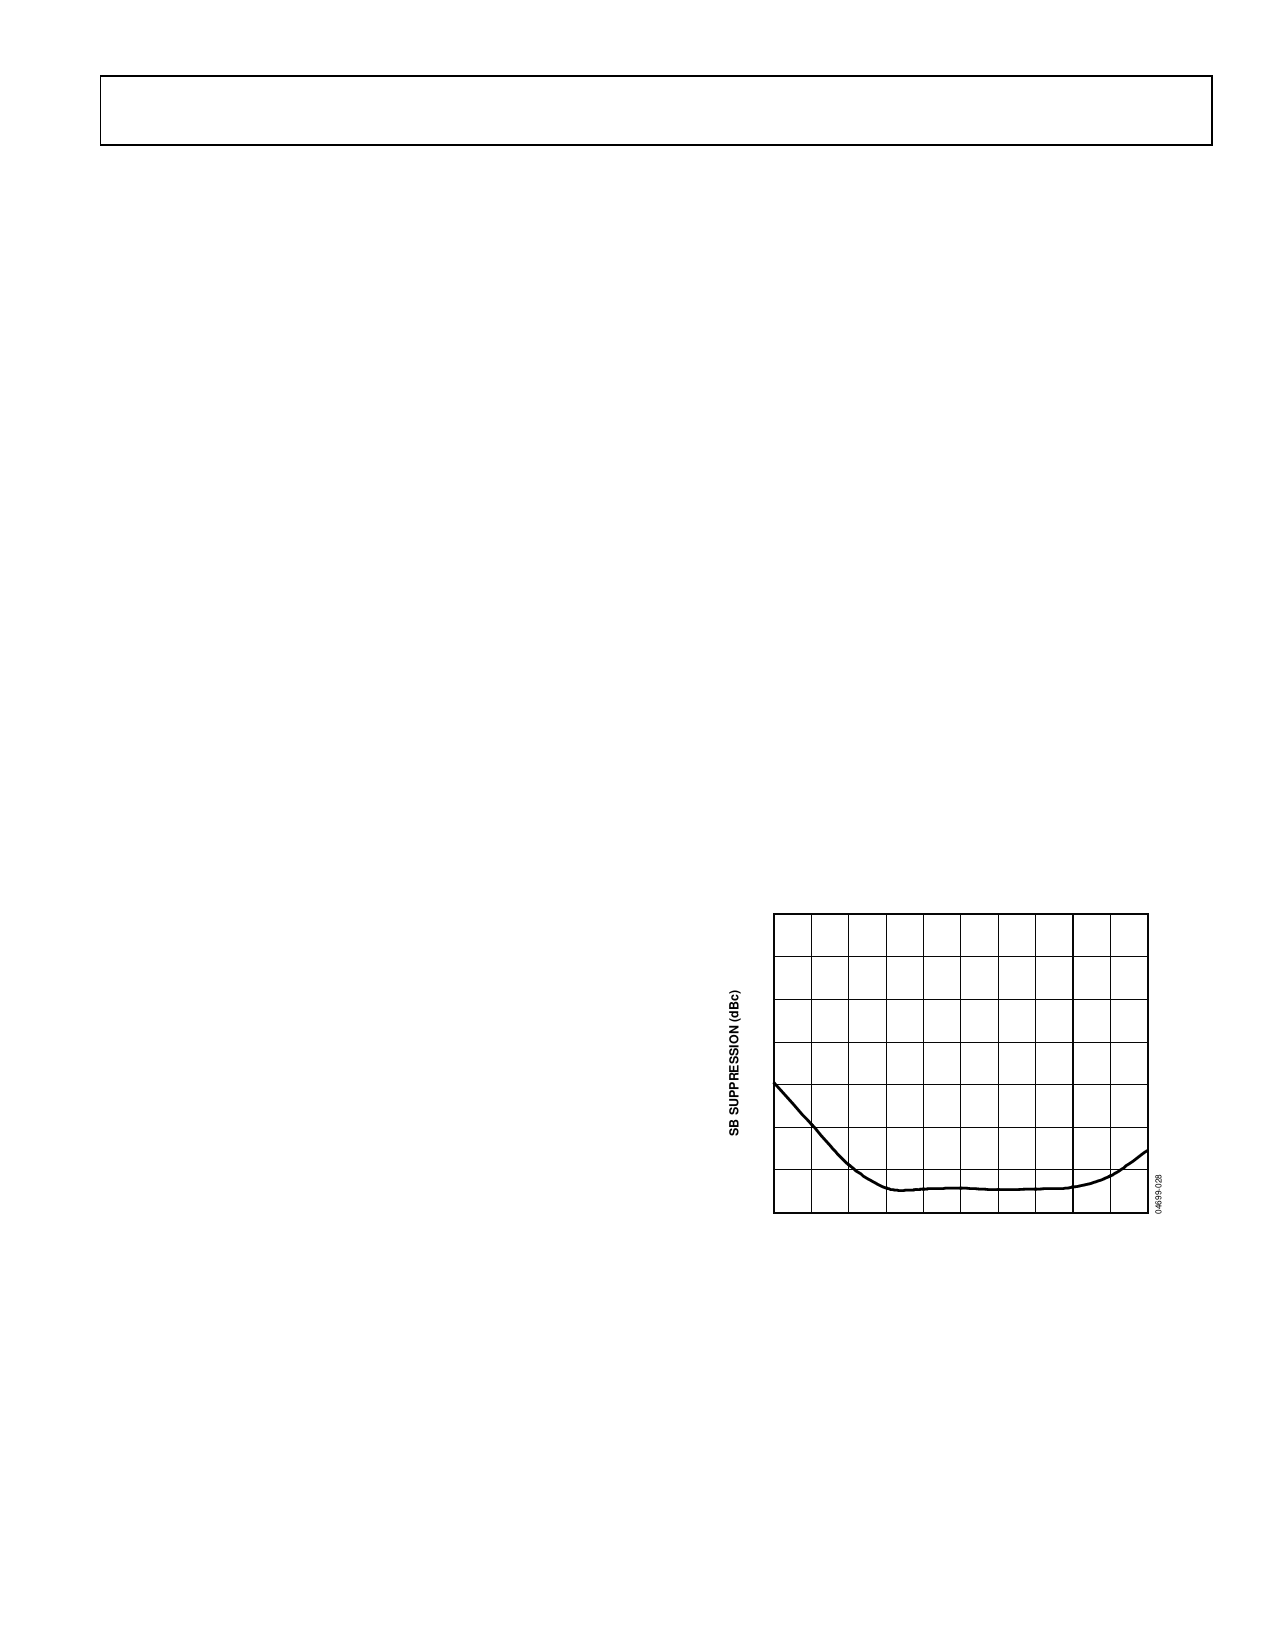
frequency range. Using the AD8340 as a single-sideband
modulator and measuring the resulting sideband suppression is
a good gauge of how the quadrature accuracy is maintained
over RF frequency. A typical plot of sideband suppression from
500 MHz to 1.5 GHz is shown in Figure 28. The level of sideband
suppression degradation outside the 700 MHz to 1 GHz specified
range is subject to manufacturing process variations.
0
–5
–10
–15
–20
–25
–30
–35
500 600 700 800 900 1000 1100 1200 1300 1400 1500
FREQUENCY (MHz)
Figure 28. Sideband Suppression vs. Frequency
Rev. C | Page 11 of 20
Share Link: 