MPX2010 Просмотр технического описания (PDF) - Freescale Semiconductor
Номер в каталоге
Компоненты Описание
Список матч
MPX2010
Freescale Semiconductor

MPX2010 Datasheet PDF : 17 Pages
| |||
Pressure
On-Chip Temperature Compensation and Calibration
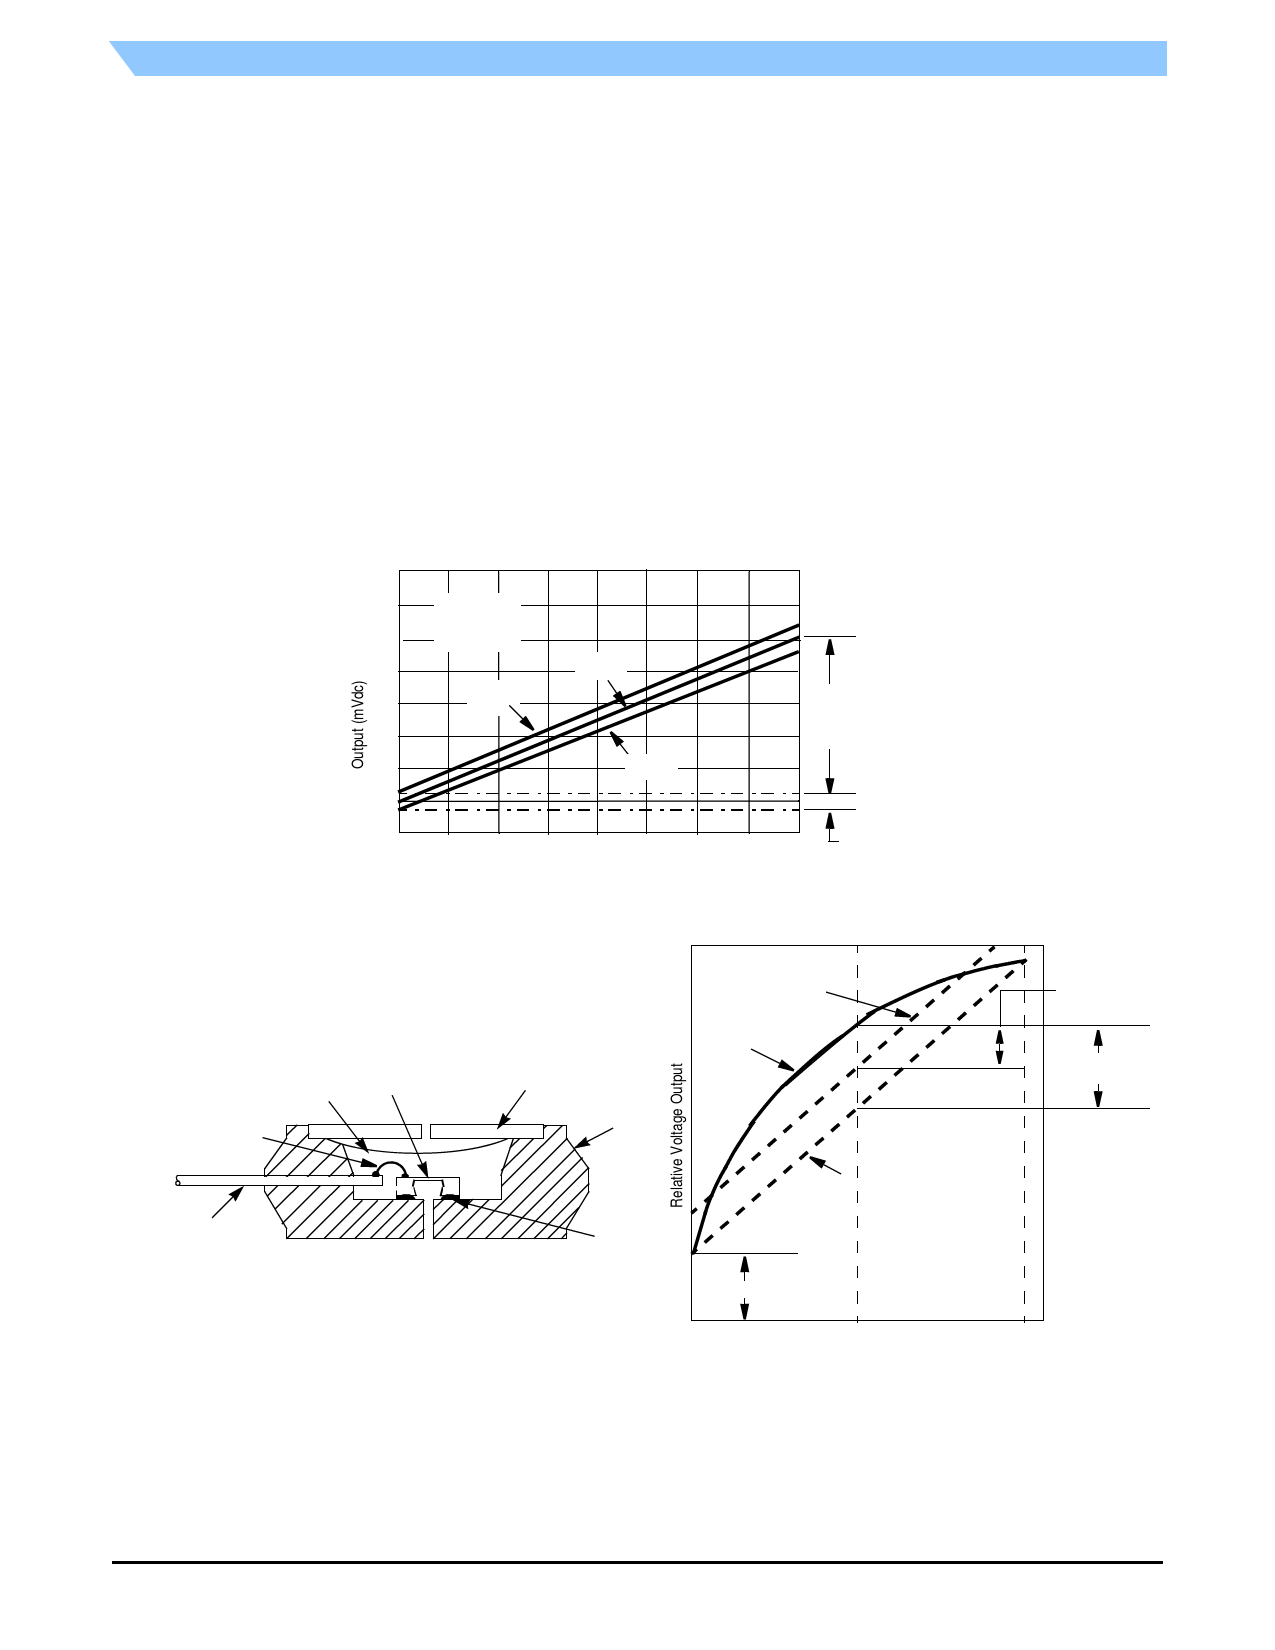
Figure 2. shows the output characteristics of the MPX2010
series at 25°C. The output is directly proportional to the
differential pressure and is essentially a straight line.
The effects of temperature on full scale span and offset are
very small and are shown under Operating Characteristics.
This performance over temperature is achieved by having
both the shear stress strain gauge and the thin-film resistor
circuitry on the same silicon diaphragm. Each chip is
dynamically laser trimmed for precise span and offset
calibration and temperature compensation.
Figure 3. illustrates the differential/gauge die in the basic
chip carrier (Case 344). A silicone gel isolates the die surface
and wire bonds from the environment, while allowing the
pressure signal to be transmitted to the silicon diaphragm.
The MPX2010 series pressure sensor operating
characteristics and internal reliability and qualification tests
are based on use of dry air as the pressure media. Media
other than dry air may have adverse effects on sensor
performance and long term reliability. Contact the factory for
information regarding media compatibility in your application.
LINEARITY
Linearity refers to how well a transducer's output follows
the equation: Vout = Voff + sensitivity x P over the operating
pressure range. There are two basic methods for calculating
nonlinearity: (1) end point straight line fit (see Figure 4.) or
(2) a least squares best line fit. While a least squares fit gives
the “best case” linearity error (lower numerical value), the
calculations required are burdensome.
Conversely, an end point fit will give the “worst case” error
(often more desirable in error budget calculations) and the
calculations are more straightforward for the user.
Freescale’s specified pressure sensor linearities are based
on the end point straight line method measured at the
midrange pressure.
30
VS = 10 Vdc
TA = 25°C
25 P1 > P2
20
15
aMAX
10
5
TYP
MIN
Span
Range
(Typical)
0
–5
kPa
2.5
5
7.5
PSI
0.362
0.725
1.09
Offset
10
(Typical)
1.45
Figure 2. Output vs. Pressure Differential
Wire Bond
Silicone
Die Coat
Die
P1
Stainless Steel
Metal Cover
Epoxy
Case
Least Squares Fit
Exaggerated
Performance
Curve
Least
Square
Deviation
Straight Line
Deviation
Lead Frame
RTV Die
Bond
P2
End Point Straight
Line Fit
Offset
Figure 3. Unibody Package: Cross Sectional Diagram
(not to scale)
0
50
100
Pressure (% Full Scale)
Figure 4. Linearity Specification Comparison
MPX2010
4
Sensors
Freescale Semiconductor
Share Link: